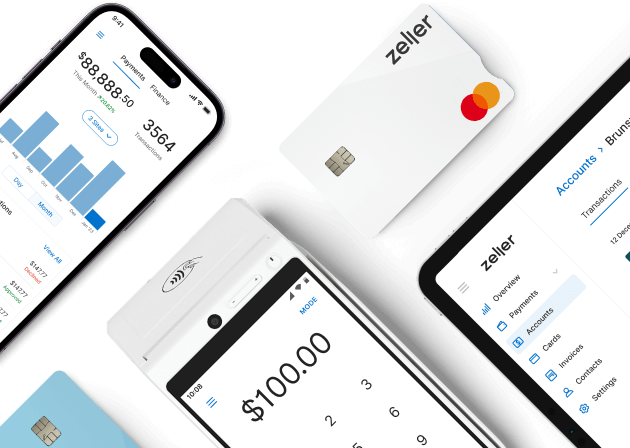
Introducing Zeller for Startups.
Don’t waste time assembling disparate tools or waiting in line at a bank. Zeller for Startups is an all-in-one financial solution for founders, by founders.

Don’t waste time assembling disparate tools or waiting in line at a bank. Zeller for Startups is an all-in-one financial solution for founders, by founders.

Speak to our expert team about your in-store payments, and we’ll personalise a solution to your business and budget.

Enjoy a free, built-in POS system with the new Zeller Terminal 2. Order today with free express shipping nationally.

Starting a new business? Enjoy a free, built-in POS system with the new Zeller Terminal 2.
9.04.2025


Let’s start with the financial KPIs, the metrics that determine if your restaurant is bringing home the bacon or just small potatoes. Keeping tabs on these money matters ensures your business has enough dough to thrive (and not just survive). Here are the key financial indicators and why they matter for your restaurant’s success:
Gross profit margin measures the percentage of your sales revenue that remains after paying for the direct costs of producing your menu items – primarily ingredients, a.k.a. your Cost of Goods Sold (COGS). In plain terms, it shows how much of each dollar from a customer’s bill you actually get to keep to cover overhead and profit. This KPI is the meat and potatoes of profitability – a healthy gross profit margin means you’re not working for peanuts. If your gross margin is slim, you might need to adjust menu prices or portion sizes, or find cheaper suppliers.
Net profit margin shows how much of each dollar in sales is pure profit after all expenses are accounted for. This metric goes beyond the kitchen costs – it factors in everything from staff wages and rent, to utility bills and marketing. In other words, net profit margin is your true bottom line, the final slice of the pie that you get to take home. By keeping an eye on net profit margin, you can make decisions like cutting unnecessary expenses or finding efficiencies so your business stays financially sustainable.
Food cost percentage represents what portion of your food sales revenue is spent on ingredients for those dishes. It’s a critical metric in the restaurant world – if this percentage is too high, it means your kitchen is eating too much of your profits. You calculate it by comparing the cost of all the food ingredients used to the revenue from food sales. Keeping food cost percentage in check ensures your pricing is on point and that portion control and sourcing are managed well. For example, if your food cost percentage is creeping above, say, 30%, you might need to negotiate better prices with suppliers or tweak menu items.
Beverage cost percentage is the drink-side counterpart to food cost percentage. It tells you how much of your beverage sales are spent on beer, wine, spirits, coffee beans, and any other drinks you serve. This KPI is especially important if your restaurant has a bar or cafe component, since margins on beverages typically are healthier than those on food. By monitoring beverage cost percentage, you can see if that fancy cocktail or flat white is delivering a solid margin or if you’re over-pouring and over-spending.
Not all menu items are created equal – some dishes are big earners and others are just along for the ride. Menu item profitability measures how much profit each dish or drink brings in, helping you identify the stars (high profit, popular items) and the black holes (low profit or slow sellers). To find a menu item’s profit, you simply subtract its ingredient cost from its selling price. Tracking this for each item matters because it lets you engineer your menu for maximum profit.
Inventory turnover ratio tells you how quickly you’re going through your stock of food and beverages in a given period. It’s like the heartbeat of your pantry – a high turnover means ingredients are flying off the shelves (fresh and fast), while a low turnover means items linger longer (risking spoilage or tying up cash). To calculate your inventory turnover ratio, divide the cost of goods sold by the average inventory value. This KPI matters because freshness is king in the kitchen – you want ingredients to move before they expire, but you also don’t want to run out mid-service. By monitoring inventory turnover, you can adjust your ordering. If turnover is too low, you might be over-ordering. If it’s too high, you may need to stock up more to avoid disappointing diners with popular dishes being sold out.
Waste and spoilage costs track how much money you throw in the bin due to expired ingredients and mistakes, or plate waste. Every scrap that goes uneaten – whether it’s veggies gone bad in the fridge or a steak that got burnt and tossed – had a cost. This KPI shines a light on those hidden expenses. While no restaurant can avoid waste entirely, keeping waste costs low is key to not chopping up your profits. Track the dollar value of food you discard and compare it to your total food cost or sales. A rising waste cost is a red flag that you might need better portion control, improved training (to reduce mistakes), or smarter purchasing. Reducing waste and spoilage directly improves your bottom line and is good for the planet too.
Offering discounts, coupons, or special promotions can spice up sales, but how do you know if these promos are worth their salt? This KPI measures how effective your discounts and promotions are at driving business. There are a few ways to gauge effectiveness – you might look at the redemption rate of a promotion (what percentage of customers used that 10% off coupon), or the sales uplift during a promo period compared to normal. A common measure is the return on investment (ROI) of a promotion, essentially comparing the additional revenue a promotion brings in against its cost (like the discounts given or advertising spend). Tracking this helps you see which deals bring in new or repeat customers and which ones just eat into your margins. By measuring promotion effectiveness, you can focus on the deals that truly pay off, and leave the lacklustre promotions on the backburner.
These days, many customers choose to enjoy their food from the comfort of their couch instead of dining in the restaurant. Your takeaway vs dine-in ratio compares revenue from off-premises orders (takeaway and delivery) to on-premises dining. It’s basically showing you where your bread is buttered, and this ratio matters because it can influence your staffing, packaging costs, and even menu (maybe your burgers sell like hotcakes for takeaway, while dine-in patrons go for steaks, for example). By keeping an eye on this KPI, you can adjust operations and marketing.
Almost all restaurants have rush hours and quiet times. Peak vs off-peak hour revenue compares the sales you rake in during your busiest periods with those in your slowest periods. This KPI matters for scheduling, promotions, and even menu offerings. A big gap between peak and off-peak might mean you’re consistently overstaffed or underutilised during slow times. By analysing this, you might decide to run specials to bring in a crowd during off-peak hours or adjust your staffing to save on labour when it’s quiet. Ultimately, understanding the sizzle and simmer of revenue throughout the day ensures you make the most of the rush and don’t burn cash during the calm.
In the hustle of hospitality, smooth operations are what keep your business cooking with gas. Operational efficiency KPIs help you understand how well your restaurant runs behind the scenes – from portion sizes and table turns to order accuracy and guest wait times. These metrics aren’t just about speed, they’re about consistency, quality, and making sure every shift runs like a well-oiled machine. Tracking them helps you find and fix bottlenecks, improve workflows, and serve up a seamless experience that keeps guests and staff smiling.
It’s no secret people don’t like stingy serves, but food wastage is something to be avoided wherever possible. Portion consistency rate measures how often your team sticks to the standard portion sizes for each dish. Keeping this consistent helps control food costs and ensures that every diner gets what they’re paying for – no more, no less.
Table turnover rate shows you how many times each table is used during a service period. A higher table turnover rate means you’re seating more guests without needing more real estate – which is key to squeezing more juice from the same lemon, so to speak. The goal is to increase revenue per table without compromising the guest experience.
Knowing how many covers (AKA diners) you're serving per table helps you understand how efficiently you're using your dining space. It gives insight into table turnover and seating optimisation, which can help you identify opportunities – like consistently underfilled tables at certain times – to increase revenue by adjusting table configurations.
This one tracks how many orders are delivered exactly as requested – no missing sides or mixed-up mains. A high accuracy rate makes for happy diners and less wastage. It also reduces the likelihood of customer complaints and comped meals, improving both satisfaction and profitability.
How long does it take from an order being placed to when it’s ready to be served? This KPI gives you a read on kitchen speed and efficiency. A consistently optimal prep time means your team is operating smoothly, which helps improve service flow and guest satisfaction. Many point-of-sale systems can help you track your order preparation time, by electronically measuring the time stamp from order input, to when it’s delivered from the kitchen to the diner. The Zeller Sales team can help recommend the best restaurant POS options, if you’re in the mood for an upgrade.
This tracks how long guests are waiting to be seated or served. Long waits might mean it’s time to review your seating strategy or staffing levels, because no one likes to be kept waiting awkwardly at the door or for a menu. Reducing wait time can also increase table turns and enhance the overall customer experience.
When guests book and don’t show, it can mean an empty table and revenue lost. This KPI tells you how often that’s happening – and whether you might need to introduce confirmation processes or deposits. Reducing no-shows ensures better table utilisation and smoother service planning.
Also called average check or cover, this shows how much each guest is spending on average. Increasing ASPG – through upselling, menu design, or specials – is a surefire way to boost revenue without increasing foot traffic.
This tracks the percentage of guests who use digital pay-at-table options, like Zeller Bill at Table. A higher rate usually means faster table turns, smoother service, and a better experience for guests (especially those in a hurry). Merchants using Zeller Bill at Table can turn tables much faster from bill request to diners out the door – up to 73% faster, in fact. On top of this, they report improved diner satisfaction and increased tipping. It’s a win all round.
It almost goes without saying that managing your team well can make or break your bottom line. Staffing and productivity KPIs shed light on how effectively your team is performing, how much they cost, and how well they’re selling. These metrics help you optimise schedules, reduce staff turnover, and boost morale, all while ensuring every hour worked contributes to your restaurant’s success. By monitoring these numbers, you can build a stronger, more efficient team that delivers great service and supports sustainable growth.
This restaurant metric tracks how often staff successfully persuade customers to add extras – drinks, desserts, sides – to their orders. It’s a direct way to drive revenue and gives you insight into how confidently your team is selling. A high upsell rate can also indicate strong staff engagement and menu knowledge.
Staff turnover rate tells you how frequently team members are leaving and needing to be replaced. A high rate could mean poor working conditions, lack of engagement, or more appealing (or higher-paying) jobs elsewhere – all of which are opportunities for you to improve. High turnover can be expensive too, as it can drive up training costs and impact service consistency, so it’s definitely something to watch.
This KPI helps you understand how much you’re spending on wages, superannuation, overtime, and benefits. Keeping labour costs in proportion to revenue is crucial for profitability in such a people-powered industry.
At the end of the day, it’s your guests who decide whether your restaurant is a hit or a miss. Customer experience KPIs measure how satisfied your diners are, how loyal they stay, and how likely they are to spread the word. These metrics give you a pulse on what your customers really think and where there’s room to improve. A great dining experience doesn’t happen by accident – it’s the result of intentional decisions that keep guests coming back for more.
Your regulars are your restaurant’s lifeblood. This restaurant metric shows what percentage of your customers keep returning – a strong indicator of satisfaction and loyalty. Tracking retention can help you spot trends, assess the impact of loyalty programs, and identify at-risk segments.
Usually gathered through surveys, your CSAT score reflects how satisfied customers are with their overall experience. A consistently high score means your service, food, and atmosphere are all hitting the spot.
Your net promoter score tells you how likely customers are to recommend your restaurant. It’s a powerful metric for gauging reputation – the higher your score, the more fans you’ve won over. A solid net promoter score signals strong word-of-mouth marketing and customer trust.
Your average star rating on platforms like Google, TripAdvisor and Facebook gives prospective guests a first impression before they even walk through the door. This KPI can be a great pulse check on the public perception of your restaurant.
Mistakes happen – what really matters is how quickly you fix them. This restaurant KPI measures how fast your team responds to and resolves customer issues, which can make the difference between a loyal customer and a lost one.
This KPI tracks how many customers actively use your loyalty program. High participation signals strong engagement and gives you more chances to further influence behaviour – through personalised offers, reward prompts, and regular interactions that keep your brand top of mind. It’s also a sign that your program is delivering value to members, making it worthy of future investment and promotion.
Switch to the preferred EFTPOS solution for thousands of Australian restaurants and cafés.